| This week was quite fun. I altered my original code so that I could input two different urls to test and visualize the running evolution's going on. Using the on campus network, the program was ran on one machine, tested on another and visualized still with another. This test took about 20 seconds to run on an individual. using 20,30 and 40 threads, I ran the program to test which thread amount would be faster, it was the 40 thread run. My mentor asked me to change the way I presented the data being taken. Before I would copy and paste the data into an Excel sheet, but I was able to learn enough of python to make a script allowing me to call the program, the name of the file and a name to save to chart as. You are looking at taco.png | 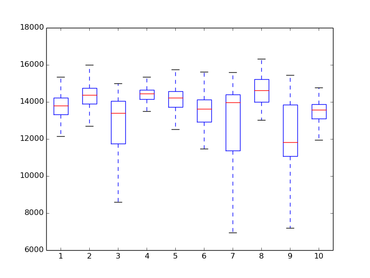 |
The last bit of stuff I need to do is look up four papers pertaining to my research and annotate them, I think this will go to the next part of the paper I'm working on.
